Soil and sediment sampling
Lauri Solismaa, Kaisa Turunen, Jari Mäkinen, Geological Survey of Finland, PO Box 1237, 70211 Kuopio, Finland; lauri.solismaa@gtk.fi, kaisa.turunen@gtk.fi, jari.mäkinen @gtk.fi
This page gives an overview of the general sampling techniques used in soil-, river- and lake sediment sampling and presents some useful monitoring parameters. These parameters can be used in monitoring the effectiviness of different closure actions.
Soil sampling principles and techniques
Lauri Solismaa, Geological Survey of Finland, PO Box 1237, 70211 Kuopio, Finland; lauri.solismaa(at)gtk.fi
Before planning any sampling of possibly contaminated soils, background surveying and documenting the history and range of activities should be done first. It is essential to have all relevant information, such as maps and results of background information studies and geological and hydrological surveys. Usually baseline studies are made before the commencement of the mining activities and theyinclude thorough documentation of the state of the mine environment prior to the mining operations. This information can be used as a reference state for defining remediation objectives. Also other environmental changes that may not have anything to do with mining activities or possible previous assessments of site contamination or attempts at remediation needs to be concidered in planning of the post remediation outcomeg (Heikkinen et al 2008).
After having all the information, planning of the sampling scheme can be taken forward. The following features are usually incorporated in investigations of contaminated soils (SGY 2002):
- Tentative plan of sampling network, including preliminary amount and location of sampling sites
- Sampling methods (for example test pits, drilling, groundwater or surface water sampling)
- Desired depth of sampling sites (for example surface sampling, sampling to bedrock interface, or water table, or to a specific sedimentary horizon) and a preliminary indication of sampling strategy (at regular intervals, or from specific layers)
- Number of samples required and volume of sample (e.g. 100 g, 0.5 l)
- Selection criteria and number of samples collected for both laboratory and in situ measurements, and analytical requirements (characterization and abundances of contaminant species)
- Sample preparation and packaging in the field
- Sample storage and labelling procedures
- Timeframe of sampling and analysis
- Occupational health and safety issues (e.g. protective clothing and precautions during sampling)
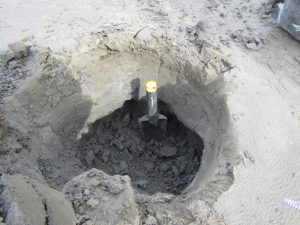
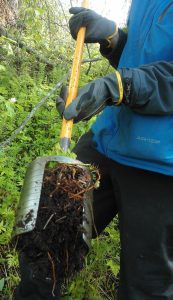
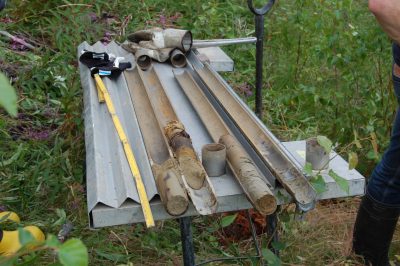
There are a variety of methods and equipment that can be used in collecting soil samples. The type of sample material, required depth and type of chosen sample all have effect to the sampling process. On shallower depths the near surface sampling can be done with simple equipment, such as showels and scoops (figures 1a and 1 b), but if sampling should be done from greater depths for stratigraphically undisturbed sample (figures 1c, 1d and 1e), or disturbed but deeper sample (figures 1f and 1g) heavier drilling equipment can be needed. Sampling equipment should be contamination free and represitentaviness of the sample should be given a high priority in planning of the sampling process. The size of the sample can be checked from the analytical laboratory. Soil/sediment samples do not need any preservatives but they should be stored in cool place and protected against sunlight and excess oxygen to avoid chemical reactions. It is also important to use a proper QA/QC protocol.


Figure 1. a) Tailings sampling point at Kostamuksha iron mine (Russia). b) A humus sample taken by a scoop. c) A peat sample taken by a Russian corer, d) An undisturbed soil sample taken by a small drill rig. e) A till sample taken by a Cobra handheld drill. f and g) A till sample taken by a RC-drill. Photos © (a, d) Lauri Solismaa, (b, f, g) Kaisa Turunen, (c) Soile Backnäs, (e) Jani Toivanen, GTK.
River and lake sediment sampling principles and techniques
Jari Mäkinen, Geological Survey of Finland, PO Box 1237, 70211 Kuopio, Finland; jari.makinen@gtk.fi
The main goal of river and lake sediment sampling is to determine the current state of the watercourse and to monitor the load ing to the watercourse during different time periods. The sampling is usually focused to the accumulation area with the assumption of undisturbed, continuous sediment accumulation. In an ideal case, the whole recent loading history can be determined from one sediment profile.
There may be significant spatial variability in the accumulation of suspended material within a basin. Therefore the selection of sampling points is crucial for gathering representative data. The general assumption is that focusing of the sediment is strongest at the deepest point of the basin. Coring at the deepest point thus can be used as a sampling strategy, especially in small and not too shallow (> 5m) lakes. As the lake size grows, wind driven currents near the bottom of the lake can cause deviating accumulation features e.g. the deepest points may become erosion areas and the accumulation may be highest at the edges of the deeps. Another general assumption is that the accumulation of suspended material starts from the depth of about 2 meters. This seems to apply only for small and shallow basins. Published formulas, usually based on the dimensions of the basin, are available to calculate the upper limit of sediment accumulation in lake basins.
Sampling in rivers with strong currents should be done from the inside of a bend, at a depth at which accumulation has occurred. In practice this is done by retrieving several samples from each coring location and visually comparing material qualities. A sample that is rich in fines and organic material is then selected for chemical composition analysis.
In Finland, the recent sediment accumulation rate can be estimated cost efficiently with the 137Cs-method. The method refers to the nuclear power plant accident of Chernobyl in 1986 that caused a 137Cs fallout peak in the sediment record. If accumulation has been stable at the coring site, the 137Cs-maximum should be at circa 5-10 cm depth (small headwater lakes and forested catchment areas). In cases of high matrix accumulation the peak can be found as deep as at 30 cm in sediment. If the 137Cs-values don’t deviate from the background or there isn’t a clear peak in the profile, the core has been taken from erosion area or the material is partially redeposited. Redeposition is most common in small shallow (2-4 m) depth lakes or in large and open basins. A sample taken from eroded area may not represent the current state of the system and the results may prove difficult to interpret.
After the current and ‘background’ (reference) sediment levels have been determined with the 137Cs-measurements and the core has been deemed suitable for analyses, calculations of the accumulation rate of the suspended material and its element content can be made.
It has to be noted that even when the sample is taken from a lake with a natural catchment area, many metal concentrations are notably large at the upper part (c. 0-20 cm) of the sediment due to past and present aerial fallout (S, Pb, sometimes V and Ni).
The uppermost 5 cm layer of sediment is often taken as the sample representing the current state. However, with a slow accumulation rate that sample represents up to 30 years of accumulation. Therefore, in a case of slow accumulation the sample representing the “natural” state is taken from shallower depth and thicker slices are used if accumulation is faster. Also the sediment’s internal element circulation, which tends to enrich certain elements to the sediment surface layer, has to be taken into account. Iron, manganese and phosphorous concentrations are often large at the uppermost part (0-1 cm) of the sediment because of their redox-driven postdepositional mobility in the sediment. The vertical concentration profiles of such elements are thus not directly related to variability in external loading from the catchment. Another factor related to the accumulation rate is the amount of suspended materials: if coarse grained suspended material rich in major silicates is transported from the catchment area, it will dilute the accumulated metal concentrations and vice versa.
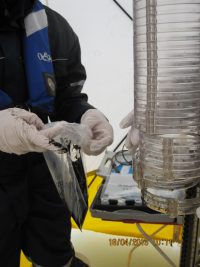
The easiest and most simple way to take sediment cores from the upper layer is to take it using a scoop-sampler (grab sampler, e.g. Ekman or Ponar type), which also mixes the sample. The sample depth range is approximate and defined by the size and weight of the sampler. A tube-type corer has to be used if more control on the depth of the sample is desired (Figure 2). Two general types of samplers are mainly used: 1) Kullenberg-type piston sounders and 2) wire operated tube-like flow-through samplers. Piston samplers have the advantage of producing completely undisturbed samples due to the suction generated with the piston that is locked at the starting depth of the coring. With the flow-through tube some of the material is being pushed to the side of the sampler, never entering the tube and causing a ‘thinning’ of the lower part of the core (so called snow shovel-effect). According to some observations the side flow is smallest at the upper most centimeters but in deeper sediments (c. > 20 cm) the side flow is about 10 % of the sample volume.


Figure 1. Certified personnel on top of lake ice in spring using a Limnos sediment corer (a-e) and a Kajak sediment corer (f) for lake sediment sampling. Taking a river sediment sample with a sediment net (g-i). Photos © (a) Kaisa Turunen, (b, c, d,e) Ulpu Väisänen, (f) Jari Mäkinen, (g) GTK, (h) Soile Backnäs and (i) Anna Tornivaara, GTK.
Chemical characterisation of sediment samples
Kaisa Turunen, Geological Survey of Finland, PO Box 1237, 70211 Kuopio, Finland; kaisa.turunen@gtk.fi
To determine the potential transformation and risk of mining in the environment for remedy decisions, the analysis of solid samples should include quantifying the total quantity and fractionation of harmful substances as well as the specific chemical forms present, a procedure known as speciation. (Melamed 2005)
Prior to chemical analysis solid samples are pretreated by drying, sieving (<2 mm grain size) and homogenization (crushing, cutting etc). In some cases, sample division and splitting is also needed. For moist samples such as tailings, peat or aquatic sediments drying by lyophilisation is recommended to avoid geochemical changes such as oxidation during the drying process. For drier soil samples such as tills, sands and bedrock air drying is more appropriate method.
Analysis of different fractions of contaminants is crucial, because unlike total concentrations, mobile and chemically adsorbed fractions reveal the potential risk that harmful elements may pose to human health and environment. The mobility and solid-phase speciation of elements is often determined using multi-step non-sequential (parallel) or sequential selective extraction procedure. In non-sequential extraction, the separate samples are leached with reagents of increasing dissolution strength, whereas as in sequential extraction the same sample is analysed sequentially in all reagents of increasing dissolution strength (e.g. Tessier et al 1979, Räisänen et al 1991, Filquieras et al. 2002, and Kahelin and Kallio 2004). The steps of the extraction procedure are presented in Table 6. Since the stronger extractions dissolves also the phases leached in weaker solutions, to get the amount of each fraction the concentration obtained in weaker extraction is subtractied from the concentration obtained in the next stronger extraction step. (e.g. Tessier et al 1979, Räisänen et al 1992, Filquieras et al. 2002, and Kahelin and Kallio 2004). Solutions obtained from cid digests and ammonium oxalate and acetate extractions are considered to represent differently bound fractions of elements that are important in assessing the ecological risks and behaviour of contaminants at the sites (c.f. Räisänen et al 1991, and Kahelin and Kallio 2004.)
As in any chemical analysis, blanks should be measured parallel with the actual samples to attain the quality-control of the measure procedure. The concentrations dissolved during the extractions can be measured by using Atomic Fluorescence Spectroscopy (AFS), Graphite Furnace Atomic Absorption (GFAA), Hydride Generation Atomic Absorption Spectroscopy (HGAAS), Inductively Coupled Plasma-Atomic Emission Spectrometry (ICP-AES), Inductively Coupled Plasma Optical Emission Spectroscopy (ICP-OES) and Inductively Coupled Plasma Mass Spectrometry (ICP-MS). (e.g. Räisänen et al 1991, and Kahelin and Kallio 2004.)
Table 1. Selective chemical extractions for analyzing element fractions in solid samples. Different sequential extraction methods can be used to analyze soluble, adsorbed, sulphide and total fractions from bedrock, soil and humus samples (modified from (Räisänen et al. 1992, Niskavaara 1995, Rautiainen et al. 1996 and Heikkinen and Räisänen 2009).
| Fraction | Extractant (dilution) | Procedure |
| Soluble phases | a) 0.01 M NH4Cl (1:50), b) 0.01 M BaCl2 (1:10) | Continuous shaking for 2 h at room temperature (RT) |
| Adsorbed phases (exchangeable, surface complexes) and carbonates | 1 M NH4Ac, pH 4.5 (1:60) | Continuous shaking for 2 h at RT, pH adjusted with acetic acid. |
| Poorly crystalline and partly crystalline Fe, Al and Mn oxyhydroxides and oxides | 0.2 M NH4-oxalate, pH 3.0 (1:100) | Shaking for 3 h, filtering after centrifugation, pH adjusted with oxalic acid. |
| Sulphides and acid soluble components of micas, clay minerals and precipitates (containing >10% of organic material) | HNO3, solution | Concentrated nitric acid leach one hour at 90 °C |
| Sulphides and acid soluble components of micas, clay minerals and precipitates | a) KClO3 – 12 M HCl + HNO3 (1:50) b) Aqua regia (AR) 12 M HCl + 4 M HNO3 (1:50) | a) HCl added twice to sample with KClO3, shaken, reacted for 30 min at RT, centrifuged, 4 M HNO added to residue, 20 min water bath at 90 °C, centrifuged, supernatant combined with KClO3-HCL-supernatant, b) AR added to the sample, shaken, reacted overnight at RT, heated for 2 h at 90 °C, diluted with distilled water |
| Residual (silicates) | a) HF-HClO4-HNO3-H2O2, b) XRF | a) Sample digested with 40% HF and 70% HClO4 on a hot plate followed by dissolution with 8 M HNO3 and addition of H2O2 |
More information of determing the chemical composition e.g. mine wastes and soil can be found here.
References
Filguieras, A. V., Lavilla, Bendicho, I., C. 2002. Chemical sequential extraction for metal partitioning in environmental solid samples, Journal of Environmental monitoring. pp. 823-857
Kahelin and Kallio 2004 H. Determination of arsenic concentrations in geological and environmental samples, in Arsenic in Finland: Distribution, Environmental Impacts and Risks (Eds. K. Loukola-Ruskeeniemi, P. Lahermo), pp. 19-28. (Geological Survey of Finland, in Finnish)
Melamed, D., 2005. Monitoring arsenic in the environment: a review of science and technologies with the potential for field measurements.Analytica Chimica Acta. Volume 532, Issue 1, Pages 1–13.
Niskavaara, H. Comprehensive cheme of analyses for soil, sediment, humus and plant samples using inductively coupled plasma atomic emission spectrometry. Geological Survey of Finland, Special Paper 20, 167 – 115. http://tupa.gtk.fi/julkaisu/specialpaper/sp_020.pdf
Parkhurst, D. L., Appelo, C. A. J. 1999. User’s guide to PHREEQC (Version 2) – A Computer Program for Speciation, Batch-reaction, One-dimensional transport, and Inverse Geochemical Calculations, Water Resources Investigations Report. pp. 99–4259. (U.S. Department of the Interior, U.S. Geological Survey.)
Reinikainen 2007. Derivation basis of threshold and guideline values for soil. The Finnish Environment 23 /2007. Finnish Environment Institute (SYKE).
Räisänen, M. L., and Hämäläinen, L. 1991. Selective sequential dissolution of polluted and non-polluted sediments. Environmentai geochemistry in northern Europe, Geological Survey of Finland, Special Paper 9. 157-162.
Räisänen, M.L., Hämäläinen, L., Westerberg, L.M. 1992. Selective extraction and determination of metals in organic stream sediments. Analyst. 3/1992. 117. pp. 623-627
Tessier, A., Campbell, P.G.C., Bisson, M., 1979. Sequential extraction procedure for speciation of particulate trace metals. Anal. Chem. 51, 844-850.
Heikkinen, P. M., Räisänen, M. L. 2009. Trace metal and As solid-phase speciation in sulphide mine tailings – Indicators of spatial distribution of sulphide oxidation in active tailings impoundments. Applied geochemistry, 24, pp. 12224-1237.
Heikkinen, P.M. & Noras, P. (Eds.) 2008. Mine Closure Handbook. Mine Closure Handbook. Environmental Techniques for the Extractive Industries, Espoo.
SGY 2002. Suomen geoteknillinen yhdistys ry. Ympäristö- geotekninen näytteenotto-opas: maa-, huokoskaasu- ja pohjavesinäytteet, moniste. 37 s. + 7 liitettä.
